MA Cross Multi Alert KrafturMA Cross Multi Alert Kraftur
Description
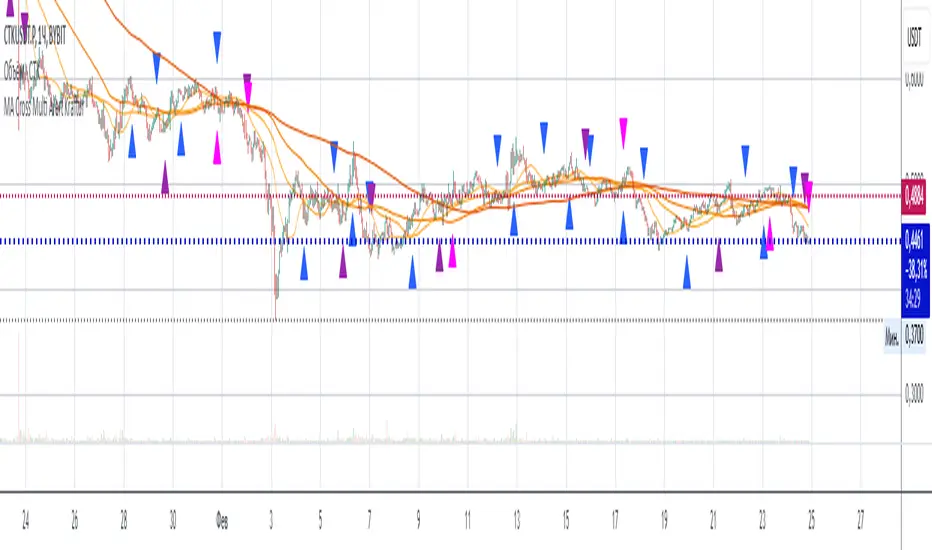
The "MA Cross Multi Alert Kraftur" indicator is a versatile tool designed to help traders identify potential buy and sell opportunities based on the crossings of multiple moving averages (MAs). Unlike traditional MA crossover indicators that focus on a single pair of averages, this script offers three distinct crossover levels (e.g., 21/50, 50/90, 50/200) for greater flexibility and precision. It overlays signals directly on the price chart and delivers real-time alerts when crossings occur, making it an excellent choice for traders seeking to pinpoint entry and exit points across various market conditions.
Key Features
Multi-Level Crossovers: Tracks crossings between configurable moving averages (e.g., 21 crossing 50, 50 crossing 90, 50 crossing 200) to detect varying trend strengths and reversals.
Visual Signals: Buy signals are displayed as upward triangles below the bars, and sell signals as downward triangles above the bars, each color-coded for quick recognition.
Real-Time Alerts: Triggers alerts once per bar when a crossover occurs, with a filter to avoid repetitive notifications during minor fluctuations.
Customizable: Adjustable MA lengths, timeframe, and signal colors allow tailoring to individual trading preferences and strategies.
Recommended Usage
This indicator shines as a scanning tool for identifying trade setups across multiple assets. Apply it to your watchlist of stocks, forex pairs, or cryptocurrencies, and set up alerts to catch crossover signals in real time. It performs exceptionally well in trending or consolidating markets and can be paired with additional tools (e.g., trendlines, RSI, or volume analysis) to validate signals and boost reliability. Ideal for multi-timeframe traders or those managing diverse portfolios.
How to Use
Add the indicator to your chart.
Adjust the MA lengths (e.g., 21, 50, 90, 200), timeframe, and signal colors to align with your trading approach.
Configure alerts for the indicator and apply them to your asset watchlist.
Watch for buy (upward triangles) and sell (downward triangles) signals on the chart, or rely on alert notifications for timely updates.
Perfect for day traders, swing traders, or anyone aiming to streamline signal detection and automate their workflow!
Cari dalam skrip untuk "ma cross"
MA Crossover + RSI Strategy [deepakks444]MA Crossover + RSI Strategy Indicator
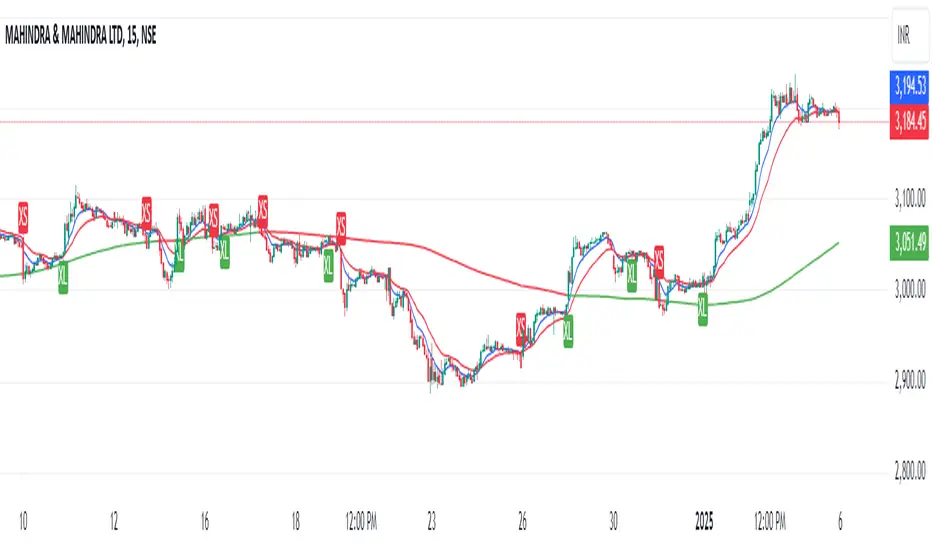
This indicator is designed to provide buy (long) and sell (short) signals based on a combination of moving average (MA) crossovers, the Relative Strength Index (RSI), and a custom moving average filter. It allows traders to identify potential entry and exit points based on price trends and momentum.
Key Components
Moving Averages (MAs):
Short EMA (Exponential Moving Average): Default length of 9.
Long EMA: Default length of 21.
These MAs are used to detect trend crossovers. A bullish trend is indicated when the short EMA crosses above the long EMA, and a bearish trend is indicated when the short EMA crosses below the long EMA.
Custom Moving Average (Custom MA):
Configurable to be one of the following: SMA (Simple Moving Average), EMA, WMA (Weighted Moving Average), or VWMA (Volume Weighted Moving Average).
Default length is 200, commonly used as a long-term trend indicator.
Color-coded dynamically:
Green: Price is above the Custom MA.
Red: Price is below the Custom MA.
Relative Strength Index (RSI):
Default length of 14.
Customizable Overbought Level (default: 60) and Oversold Level (default: 40).
Provides a momentum filter to ensure trades are taken when the market exhibits strong trends in a favorable direction.
Signal Logic
Buy Signal (Long Entry - XL):
The Short EMA crosses above the Long EMA (bullish crossover).
RSI value is above the oversold level (indicating momentum is not excessively weak).
The price is above the Custom MA, confirming alignment with the prevailing trend.
Sell Signal (Short Entry - XS):
The Short EMA crosses below the Long EMA (bearish crossover).
RSI value is below the overbought level (indicating momentum is not excessively strong).
The price is below the Custom MA, confirming alignment with the prevailing trend.
Pending Signals
Pending signals account for situations where the crossover and RSI conditions are met, but the price has not yet crossed the Custom MA. These are tracked to activate only when the price moves in alignment with the Custom MA:
Pending Buy:
Triggered when:
Short EMA crosses above Long EMA.
RSI > Oversold Level.
Price is below the Custom MA.
Activates when the price crosses above the Custom MA.
Pending Sell:
Triggered when:
Short EMA crosses below Long EMA.
RSI < Overbought Level.
Price is above the Custom MA.
Activates when the price crosses below the Custom MA.
Visual Elements
EMA Lines:
Blue Line: Short EMA.
Red Line: Long EMA.
Custom MA:
Green: Indicates price is above the Custom MA.
Red: Indicates price is below the Custom MA.
Signal Arrows:
Green UP Arrow (XL): Buy signal.
Red DOWN Arrow (XS): Sell signal.
Alerts
Configurable alerts notify the user when:
Buy Signal: "Price crossed above the short EMA and RSI is oversold."
Sell Signal: "Price crossed below the short EMA and RSI is overbought."
Strategy Overview
This strategy combines trend-following (EMA crossovers) and momentum confirmation (RSI) with a Custom MA filter to ensure trades align with broader market trends. The Custom MA acts as a safety check, preventing trades against the prevailing trend.
Disclaimer
This script is for educational purposes only. Trading involves significant financial risk, and past performance is not indicative of future results. Use this script at your own discretion, and always backtest before deploying it in live markets. The author is not responsible for any financial losses incurred while using this script.
Suitability
This indicator is suitable for traders who prefer to combine trend-based strategies with momentum confirmation to filter out false signals and increase trade reliability.


MA Crossover Detector
The Moving Average Crossover Detector is a custom indicator that visually shows buy and sell signals clearly on the chart. based on the crossing of two moving averages — a popular and beginner-friendly tool in technical analysis.
It plots two moving averages — One fast (short period) and one slow (long period) — and highlights crossover points:
✅ Buy Signal (Golden Cross) – When the fast MA crosses above the slow MA.
❌ Sell Signal (Death Cross) – When the fast MA crosses below the slow MA.
✅ Features
Visual: Clearly shows crossovers on the chart.
Customizable: Choose periods, types, styles, etc.
Alert-ready: You can set alerts for crossovers.
The Moving Average (MA) Crossover Strategy is one of the simplest and most widely used strategies in technical analysis for trading stocks, forex, crypto, and other markets. It relies on the interaction between two moving averages to generate buy and sell signals.
Core Components
Short-Term Moving Average (Fast MA) : Reacts quickly to price changes (e.g., 9-period or 20-period).
Long-Term Moving Average (Slow MA) : Reacts more slowly to price changes (e.g., 21-period or 200-period).
How the Strategy Works
Bullish Crossover (Golden Cross):
Occurs when the fast MA crosses above the slow MA. Interpreted as a buy signal, indicating a potential uptrend.
Bearish Crossover (Death Cross):
Occurs when the fast MA crosses below the slow MA. Interpreted as a sell signal, indicating a potential downtrend.
Common Variants
Short-term trading
9 EMA
21 EMA
Swing trading
20 SMA
50 SMA
Long-term investing
50 SMA
200 SMA
Pros
Easy to understand and implement
Works well in trending markets
Can be automated for backtesting and execution
Cons
Lagging indicator: MAs are based on past prices, so signals come after the move has started.
Choppy markets = whipsaws: Generates false signals in sideways/range-bound conditions.
May underperform in volatile or mean-reverting environments
Tips for Improvement
Use confirmation tools : e.g., RSI, MACD, volume analysis, price action
Add filters : Trend filter (ADX), volatility filter (ATR), or time filter (session-based)
Combine with price structure : Support/resistance, breakouts, pullbacks

MA Cross MTF Alert (Miu)This script extends the classic moving average crossover strategy with support for up to 8 user-defined symbols across 4 custom timeframes, combined with a visual and alert system designed for traders who monitor multiple assets simultaneously.
Unlike traditional MA crossover tools, this script enables traders to receive real-time alerts for crossovers across multiple assets and timeframes, even when the script is not actively displayed on the chart — ideal for passive monitoring in multi-asset strategies.
What it does:
This script calculates two customizable moving averages (SMA or EMA) for each selected symbol and timeframe.
It then tracks crossover events:
- Bullish crossover when the fast MA crosses above the slow MA
- Bearish crossunder when the fast MA crosses below the slow MA
On the chart, it also displays the crossover signals for the current symbol and timeframe using color-coded cross icons.
Key features:
- Select SMA or EMA type for both moving averages
- Customize MA lengths and colors
- Works with any asset and timeframe
- Alerts include symbol and timeframe info for easy identification
How to use:
1) Add the indicator to your chart.
2) Choose the moving average type and lengths.
3) Enable/disable any of the 8 symbols and 4 timeframes.
4) Set up TradingView alerts by clicking “Create Alert” and selecting one of the alert() calls.
5) You will receive a message like:
BTC (1h) | MA Crossover ▲ or ETH (15m) | MA Crossunder ▼
Technical note:
This script uses request.security() to retrieve moving average values from up to 8 different symbols and 4 different timeframes in real time.
Feel free to leave your feedback or suggestions in the comments section below.
Enjoy!

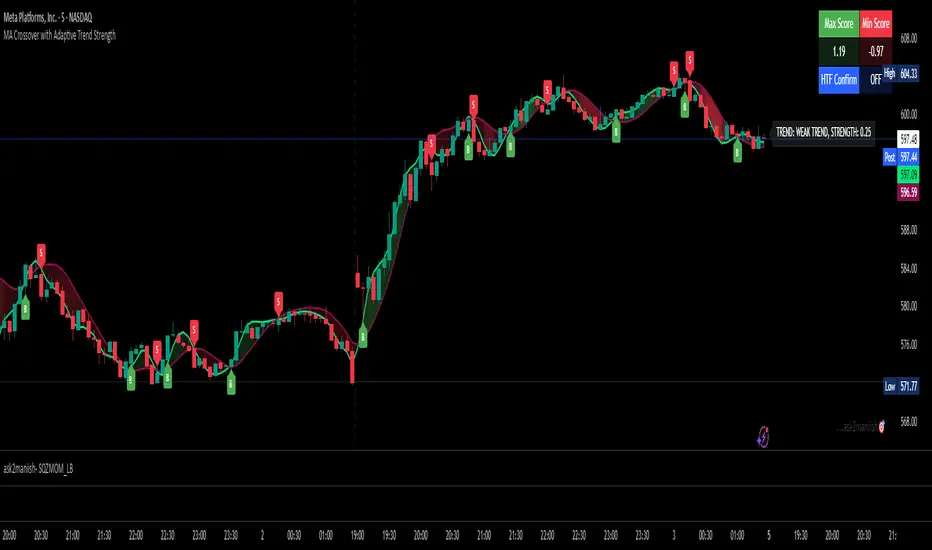
MA Crossover with Adaptive Trend Strength📘 MA Crossover with Adaptive Trend Strength —
📌 Overview
This TradingView indicator plots two moving averages (Fast & Slow) with user-selected types (T3, EMA, SMA, HMA), visual crossovers, and dynamically calculates an adaptive trend strength score using Z-scores of multiple features. Optional higher timeframe (HTF) confirmation is supported. A color-filled region between the MAs visually indicates momentum direction.
⚙️ Inputs & Controls
📈 Moving Average Settings
Fast MA Length: Length of the fast-moving average (default: 9).
Slow MA Length: Length of the slow-moving average (default: 21).
MA Type: Type of moving average used (T3, EMA, SMA, HMA).
Source: Input data source (default: close).
T3 Volume Factor: Only used when T3 is selected, controls smoothing (range: 0–1).
🎨 Visual Controls
Bullish Fill Color: Fill color when Fast MA is above Slow MA.
Bearish Fill Color: Fill color when Fast MA is below Slow MA.
Show Gradient Fill: Enable or disable the colored area between Fast & Slow MAs.
Trend Label Position: Choose where the trend strength label appears (top or bottom).
Label Update Interval: Number of bars between label updates (reduces clutter).
⏱ Multi-Timeframe Support
Higher Timeframe: Timeframe used for confirmation (default: 60 min).
Use HTF Confirmation: Enables filtering of trend score by higher timeframe trend direction.
📊 Lookback Configuration
Auto Lookback Based on Timeframe: Dynamically adapts scoring lookback period per chart timeframe.
Manual Lookback: Manual fallback lookback length when auto is off.
🧮 MA Calculation Options
T3 MA: Custom T3 function with exponential moving averages and volume factor.
EMA/SMA: Built-in Pine functions (ta.ema, ta.sma).
HMA: Hull Moving Average using WMA calculations.
📉 Trend Strength Calculation
🧠 Z-Score Inputs
Distance between MAs (zDist)
Slope of the Fast MA (zSlope)
Volume (zVol)
ATR (zATR)
📏 Choppiness & Adaptive Weighting
A Choppiness Index (based on ATR & price range) reduces score impact in sideways markets.
Dynamically adjusts Z-score weights:
W1: Distance
W2: Slope
W3: Volume
W4: ATR
🔁 HTF Confirmation
Optionally multiplies the trend score by the direction of the higher timeframe trend to filter noise.
🟩 Plot & Visual Elements
📊 MA Lines
Plots Fast and Slow MA lines in colors based on selected MA type.
🌈 Gradient Fill
Fills the area between Fast and Slow MAs with opacity proportional to their difference.
Colors based on bullish/bearish condition.
🏷️ Trend Strength Label
Updates every n bars (Label Update Interval).
Shows:
Trend Classification: Weak, Moderate, Strong
Numerical Score
Label position (top or bottom) is configurable.
🔔 Crossover Signals
Bullish Crossover ("B"): Fast MA crosses above Slow MA.
Bearish Crossover ("S"): Fast MA crosses below Slow MA.
Labels are plotted at crossover points.
Old labels are removed after a threshold (100) to reduce chart clutter.
📋 Score Summary Table
A table showing:
Max Score within the lookback period
Min Score
HTF Confirmation Status (ON / OFF)
Updates on the same user-defined interval as the trend label.
🚨 Alerts
Condition Description
Bullish MA Cross Fast MA crosses above Slow MA
Bearish MA Cross Fast MA crosses below Slow MA
These are provided via alertcondition() for use in alert creation.
📌 Customization Tips
Turn off the gradient fill for a cleaner chart.
Use HTF confirmation to reduce false positives in ranging markets.
Adjust label update frequency to prevent visual clutter on faster timeframes.
Use T3 MA with volume factor for smoother signals in volatile markets.
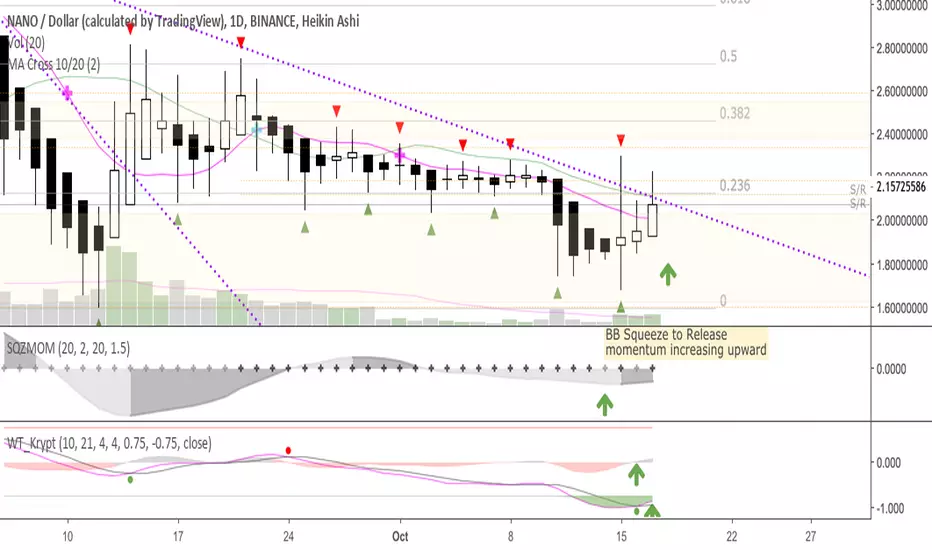
MA Cross 10/20This was originally derived from "MA Cross" indicator, though that one uses 9-21.
Simple 10day and 20day MA crossover indicator
* 10MA crosses from the bottom, goes up and above 20MA—we're bullish, look to long bullish signal candle
* 10MA crosses from the top, goes down and below 20MA—we're bearish, look to short bearish signal candle
Works well w/ Heikin Ashi candles
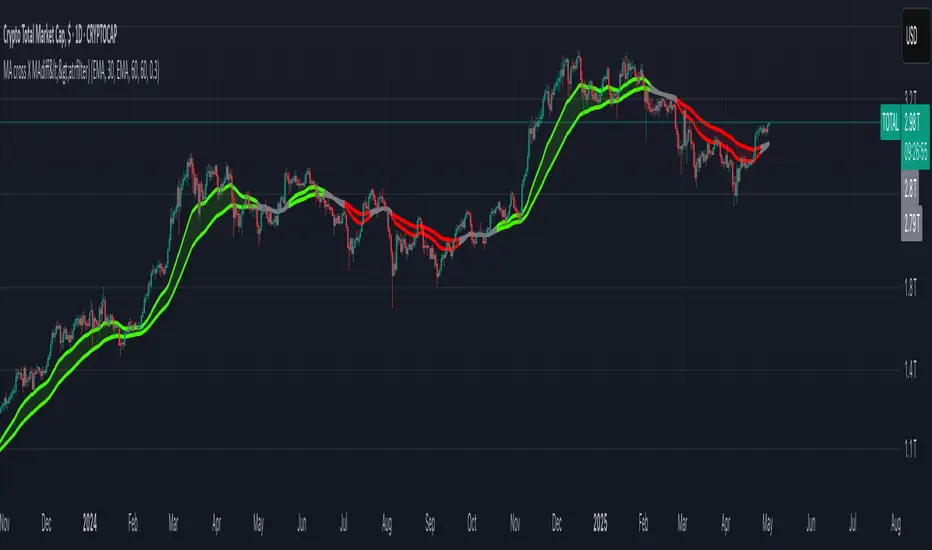
MA cross X MAdiff<>atrfilter)📈 MA cross X MAdiff<>ATR filter
Smarter Trend Confirmation Using Adaptive Volatility Thresholds
🔍 What It Does
This indicator upgrades classic moving average crossovers by adding volatility awareness via ATR filtering. Instead of reacting to every small crossover, it waits for the distance between two moving averages to exceed a volatility-adjusted threshold, making signals more meaningful and less noisy.
⚙️ Core Logic
Calculates the difference between a Fast MA and a Slow MA.
Uses Average True Range (ATR) as a dynamic volatility filter.
Confirms trend only when MA difference exceeds:
diff > ATR × multiplier → Bullish
diff < -ATR × multiplier → Bearish
Otherwise: Neutral (gray zone)
The gray zone avoids false signals by detecting indecision or choppy markets.
🧠 Customizable Inputs
Choose any MA type independently for Fast and Slow:
SMA, EMA, WMA, VWMA, RMA, DEMA, TEMA, LSMA, Kijun
Control sensitivity via:
ATR Length
ATR Multiplier
✅ Why It Works
Reduces fake outs in ranging markets.
Adapts to volatility automatically.
Fully customizable for any asset or style.
Ideal for trend traders, momentum entries, or as a confluence layer.
MA Cross ScreenerThis script lets you pick 20 symbols to check for ma crosses. The way it works is it scans all 20 of your symbols for moving average crosses and then it sends an both a regular alert and a visual alert inside of the indicator. I found that ma cross strategies are very popular right now so I thought it would be nice to have one indicator instead of 20 discord servers. The features include: 20 custom symbols, alerts, custom colors, ma select, and custom time frames. If you want to use the custom time frame option, use the lowest time frame possible. That way you wont have gaps. If you have any comments please voice them, that includes suggestions!
I hope you all find this useful!

MA Cross 100-200Very simple to use. Buy signal if price is above red 100 MA. Very strong buy signal if price crosses above 200 MA too.Confirmed after the 100 MA crosses above the blue 200 MA.
Sell signal if price closes under 100 MA, very strong sell signal if price closes below 200 MA, Confirmed short if death cross of 100 MA crossing below 200 MA.
Best used on 4h,12h, and daily, but you can try it and backtest it on lower TF too if it works for you.

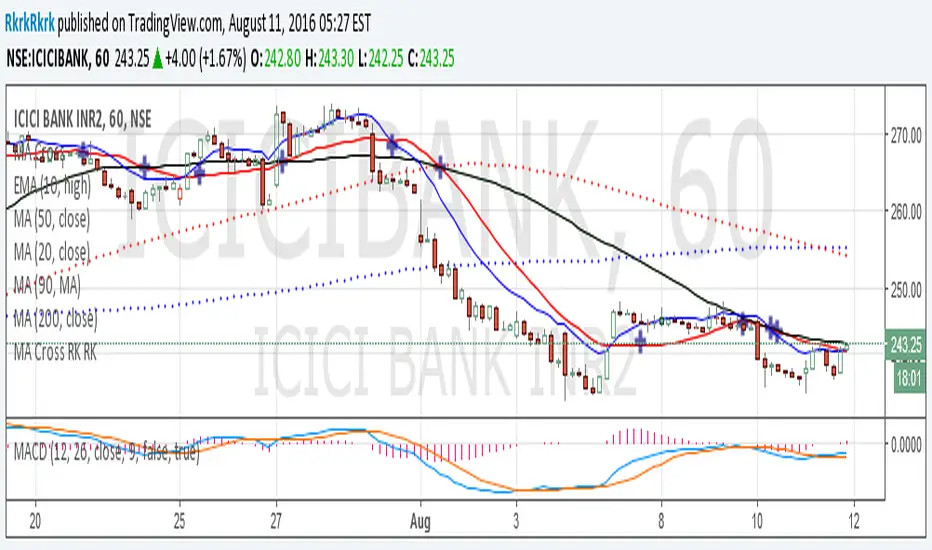
MA CrossA simple configurable MA Cross (3 MAs) script. You can choose between SMA and EMA , you will get arrows up or down when MAs cross each others. The arrows have different transparency and length parameters so you can easily identify them:
- small arrow and the most transparent for fast and medium MA crosses
- medium arrow for fast and slow MA crosses
- long arrow with no transparency for medium and slow MA crosses
Default values that can be changed:
- MA type = EMA
- Source for all MAs = close
- Fast MA length = 20
- Medium MA length = 50
- Slow MA length = 200
I plan on adding feartures overtime.

MA Crossover Scalper [4H]//@version=5
indicator("MA Crossover Scalper ", overlay=false)
// Market Cap Filter (Volume as proxy)
volumeValid = volume >= 500000 and volume <= 4000000
// MA Crossover System
ma9 = ta.sma(close, 9)
ma21 = ta.sma(close, 21)
bullishCross = ta.crossover(ma9, ma21) and close > ma21
bearishCross = ta.crossunder(ma9, ma21) and close < ma21
// Volume Confirmation
volumeSpike = volume > ta.sma(volume, 20) * 1.3
// Final Signals
bullSignal = bullishCross and volumeSpike and volumeValid
bearSignal = bearishCross and volumeSpike and volumeValid
// Output for Screener
plot(bullSignal ? 1 : 0, "Bull MA Cross", color=color.green)
plot(bearSignal ? 1 : 0, "Bear MA Cross", color=color.red)

MA Crossover [AlchimistOfCrypto]🌌 MA Crossover Quantum – Illuminating Market Harmonic Patterns 🌌
Category: Trend Analysis Indicators 📈
"The moving average crossover, reinterpreted through quantum field principles, visualizes the underlying resonance structures of price movements. This indicator employs principles from molecular orbital theory where energy states transition through gradient fields, similar to how price momentum shifts between bullish and bearish phases. Our implementation features algorithmically optimized parameters derived from extensive Python-based backtesting, creating a visual representation of market energy flows with dynamic opacity gradients that highlight the catalytic moments where trend transformations occur."
📊 Professional Trading Application
The MA Crossover Quantum transcends the traditional moving average crossover with a sophisticated gradient illumination system that highlights the energy transfer between fast and slow moving averages. Scientifically optimized for multiple timeframes and featuring eight distinct visual themes, it enables traders to perceive trend transitions with unprecedented clarity.
⚙️ Indicator Configuration
- Timeframe Presets 📏
Python-optimized parameters for specific timeframes:
- 1H: EMA 23/395 - Ideal for intraday precision trading
- 4H: SMA 41/263 - Balanced for swing trading operations
- 1D: SMA 8/44 - Optimized for daily trend identification
- 1W: SMA 32/38 - Calibrated for medium-term position trading
- 2W: SMA 17/20 - Engineered for long-term investment signals
- Custom Settings 🎯
Full parameter customization available for professional traders:
- Fast/Slow MA Length: Fine-tune to specific market conditions
- MA Type: Select between EMA (exponential) and SMA (simple) calculation methods
- Visual Theming 🎨
Eight scientifically designed visual palettes optimized for neural pattern recognition:
- Neon (default): High-contrast green/red scheme enhancing trend transition visibility
- Cyan-Magenta: Vibrant palette for maximum visual distinction
- Yellow-Purple: Complementary colors for enhanced pattern recognition
- Specialized themes (Green-Red, Forest Green, Blue Ocean, Orange-Red, Grayscale): Each calibrated for different market environments
- Opacity Control 🔍
- Variable transparency system (0-100) allowing seamless integration with price action
- Adaptive glow effect that intensifies around crossover points - the "catalytic moments" of trend change
🚀 How to Use
1. Select Timeframe ⏰: Choose from scientifically optimized presets based on your trading horizon
2. Customize Parameters 🎚️: For advanced users, disable presets to fine-tune MA settings
3. Choose Visual Theme 🌈: Select a color scheme that enhances your personal pattern recognition
4. Adjust Opacity 🔎: Fine-tune visualization intensity to complement your chart analysis
5. Identify Trend Changes ✅: Monitor gradient intensity to spot high-probability transition zones
6. Trade with Precision 🛡️: Use gradient intensity variations to determine position sizing and risk management
Developed through rigorous mathematical modeling and extensive backtesting, MA Crossover Quantum transforms the fundamental moving average crossover into a sophisticated visual analysis tool that reveals the molecular structure of market momentum.

MA Cross 10/50/200 HasanVeliit is for 10 ma, 50 ma and 200 ma cross. You can youse 3 ma at the same time.


MA Cross Ribbon + [RSI,StochRSI,VolOsc,RoC,Compare,Info Panel]
Draws all sorts of useful information directly onto the Chart
Moving Average Ribbon with configurable offsets
Allows you to easily visualize MA Crossovers
Easy to view in the Data Window
RSI Indicator (Overbought, Oversold, Healthy)
Stochastic RSI
Volume Oscillator (Bullish, Bearish, Healthy)
Rate of Change Indicator
Compare Symbol without adding a new scale (Symbol, Timeframe, Divider)
Moving the chart around won't ruin your comparison
Allows you to see the general sentiment of all your configured averages at a glance
100% Configurable
If there is anything you would like added please comment, It's very likely I will be adding more things to this.

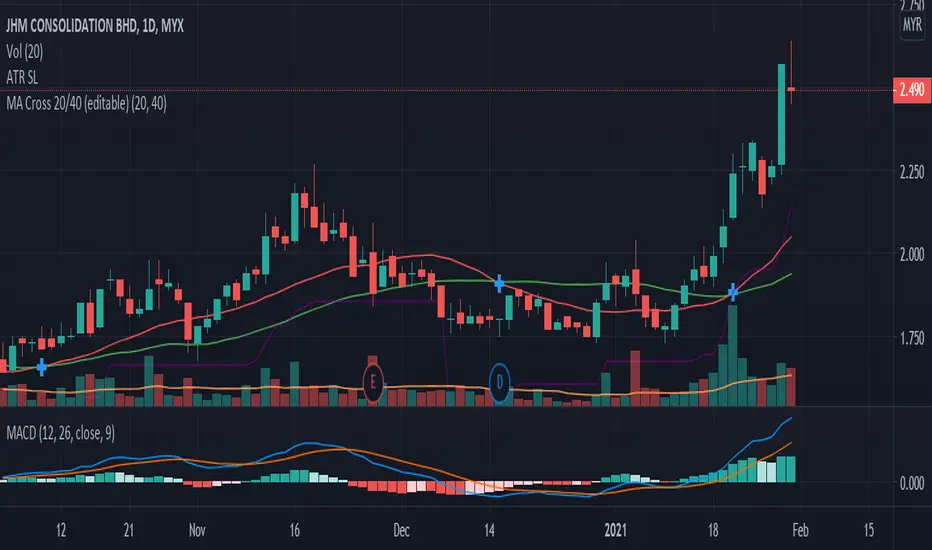
MA Cross 20/40 (editable)Simple script using the built in MA Cross script as the base but default to 20/40 MA and added option to edit the short and long duration values which the default script doesn't allow you to edit. My first script, it's yours for free. Be kind.